M.C. Escher: More Mathematics
Than Meets the Eye
Sara Robinson
SIAM News, Number 8, October 2002
|
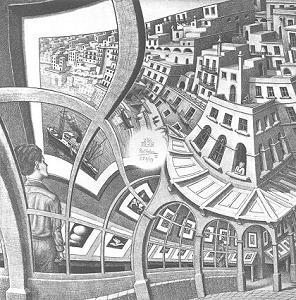
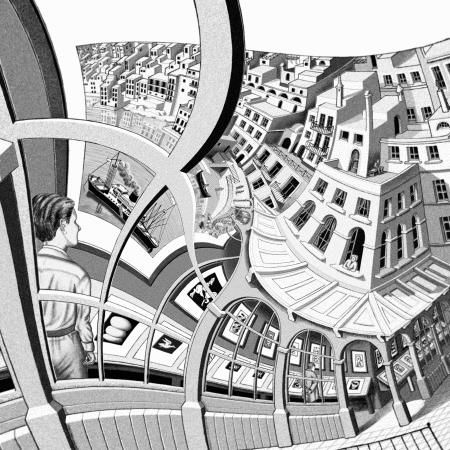
| "Print Gallery," by M.C. Escher. Curious about the blank spot in the middle of Escher's 1956 lithograph, Hendrik Lenstra set out to learn whether the artist had encountered a mathematical problem he couldn't solve. ©2002 Cordon Art B.V., Baarn, Holland. All rights reserved. |
As a teenager, number theorist Hendrik Lenstra was fascinated by the mathematical themes of M.C. Escher's artwork. A few years later, however, he lost his early enthusiasm for the Dutch artist, finding real mathematics "much more exciting."
Today, Lenstra is once again an Escher enthusiast. He owns more than a dozen books about the artist, two documentary videos, and an assortment of Escher ties, and is in the process of acquiring an original print of Escher's "Print Gallery," a wellknown work for which Lenstra now has a particular affection.
"I came to realize that there is much more mathematics in Escher's work than first meets the eye," says Lenstra, who holds joint positions at the University of California, Berkeley, and the Universiteit Leiden, in the Netherlands.
Using the theory of elliptic curves, Lenstra has shown that the distortion of the quayside scene depicted in "Print Gallery" can be described by a complex exponential function. This quirky finding has been featured in The New York Times, on Dutch television, and in several Dutch newspapers.
A Mysterious Blank Patch
Lenstra's project began two and a half years ago on a Continental Airlines flight from New Jersey to Amsterdam. Browsing through the airline magazine, Lenstra spotted a picture of "Print Gallery" and was struck by a seeming flaw in its construction.
The lithograph depicts a view, through a row of arching windows, of a man looking at a picture on the wall of a gallery. In the picture, a row of Mediterranean-style buildings along a quay looms larger and larger until it extends right out of the picture frame and curves around to include the gallery and the man within it. The picture continuously expands in scale as the eye moves clockwise about the center. At the same time, the lines of the picture curve, as if someone had reached into the center and pulled it outward with a twist of the wrist.
But the vision is incomplete: Smack in the center of the picture is a large, circular patch that Escher left blank. Lenstra was bothered by the apparent blemish in the otherwise consistent strucure of the picture. With many hours still to kill on his flight, he formulated two precise mathematical questions.
"First," he says, "I wondered if, when you try to continue the arcs and lines, there is a mathematical problem you cannot solve." His second question was: "What is the overall mathematical structure of this picture?"
Readers might be surprised that Lenstra would have expected Escher's lithograph to have a simple and consistent mathematical structure. Although fascinated by visual mathematical concepts, Escher (1898-1972) had only a high school education in mathematics and little interest in its formalities. But to Lenstra, it was immediately clear that the mathematics was there. "It's clear when you look at "Print Gallery" that some transformation is being used," he says. "And transformations belong to mathematics, so it was pretty evident that at least the question of how I, as a mathematician, would make the print, made sense."
A few days after his arrival in Holland, Lenstra took the first step toward answering his questions. He consulted his copy of The Magic Mirror of M.C. Escher, a book by Hans de Rijk (written under the pen name Bruno Ernst). De Rijk was a friend of Escher's and had visited him several times during the creation of "Print Gallery." In the book, which was authorized and corrected by Escher, de Rijk described Escher's method in detail.
How Did Escher Do It?
|
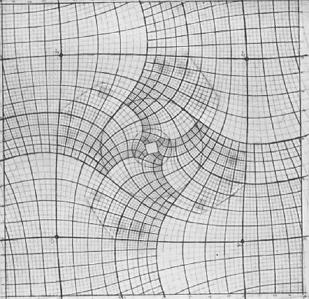
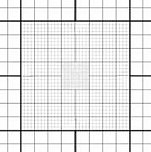
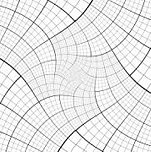
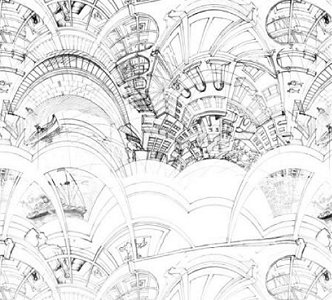
| Escher's distorted grid. Escher imposed a straight grid on the scene to be depicted in "Print Gallery" and then transferred the picture, one grid element at a time, to the distorted grid. ©2002 Cordon Art B.V., Baarn, Holland. All rights reserved. |
The effect Escher was trying to achieve, de Rijk explained, was a continuous circular expansion, "a bulge in a closed ring formation, having neither beginning nor end." To provide a precise framework for his technique, Escher first created his expansion on a grid of lines, making the size of the squares grow by a factor of 256 as he moved along a square loop about the center (see illustration page two, top). Then, starting with an ordinary picture of a row of buildings on a quay, including the gallery, he placed a straight grid over the picture and translated the picture from the undistorted grid to the distorted one, one grid cell at a time.
Looking at Escher's distorted grid, pictured in de Rijk's book, Lenstra was able to imagine what the straightened grid must have looked like. He saw that walking along a clockwise square path about the center of the distorted grid corresponds in the straight picture to walking along a square path with ever-shortening sides, moving inward to a point where everything is smaller by a factor of 256. Thus, Lenstra deduced, the ordinary picture Escher started with must have the property that blowing it up or shrinking it by a factor of 256 gives the same picture again. Mathematically speaking, the straight picture is periodic with a multiplicative period of 256.
Lenstra calls the straight picture a "Droste picture," after the picture on the box of the Dutch Droste-brand cocoa. The Droste box shows a rather grim looking maid in a cap and apron, holding a Droste box, on which is a copy of the maid, and so on. The straightened Escher picture, Lenstra saw, would have the same property.
Looking at the distorted grid again, Lenstra also saw that a counterclockwise walk along a square path about the center of the "Droste picture" would become an inward spiral in the Escher picture, ending at a point rotated a little more than 180 degrees from the starting point. This walk corresponds to moving a constant number of squares on the distorted grid (up then left then down then right) circling about the center.
This creates a spiral whose endpoints are the same in the Droste picture, so they must be identified in the Escher picture as well. The Escher picture thus has the property that rotating and shrinking it substantially gives the same picture again. In mathematical terms, the Escher picture, too, is periodic, but its period is a complex number g rather than a real number.
Stated in another way, the Droste picture can be thought of as a function f from the non-zero complex numbers to the colors black and white with the property that f(256z) = f(z). The Escher picture, on the other hand, is given by a function g from the non-zero complex numbers to black and white with the property that g(gz) = g(z).
This realization easily resolved the question of what belongs in the center: a smaller version of the same scene, rotated until it is almost upside down and containing another copy of itself, and so on, disappearing into a singularity at the origin. But Lenstra still wanted to compute an actual value for g, the complex period of the Escher picture. Armed with that, he would have a mathematical formula for creating such a picture.
Working toward this end, Lenstra made some crude measurements of the rotation and expansion of the grid and found that the real part of g was somewhere between -16 and -19, and the imaginary part between 5 and 6. This seemed to be the best he could do, until he read a key sentence in de Rijk's description.
Escher's first attempt at the cyclic bulge, de Rijk explained, used straight lines that gradually spread apart. Escher was unhappy with this model, however, because the buildings and windows of the picture would be overly distorted. Escher then curved the lines in his grid so as to ensure that "the original small squares could retain their square appearance," de Rijk wrote.
After reading that sentence, Lenstra had a flash of insight. "I knew exactly what was happening," he says. "I knew that the Escher picture must be conformal." As a reminder to readers who last thought about conformality in the distant past (or who missed Philip Davis's review of Indra's Pearls in the September issue of SIAM News), a conformal map is one that locally preserves angles. Any analytic function on the complex plane is conformal at every point where its derivative is non-zero.
Once Lenstra knew that the map was conformal, he was able to bring elliptic curve theory to bear on the problem of computing g. This is how he did it:
Because the Escher picture is periodic with period g, it lives on C*/gz. Similarly, the Droste picture lives on C*/256z. With logarithms to transform the underlying multiplicative groups into additive ones, the first group becomes C/Z×log g + Z×2pi and the second, C/Z×log 256 + Z×2pi, where the 2pi comes from the periodicity of the exponential function in the complex plane. Each of these structures – the complex numbers modulo a lattice – is an elliptic curve.
The key sentence in de Rijk's book implies that these two elliptic curves must be conformally isomorphic, which means that the underlying lattices must be the same modulo rotation and scaling.
This assumption, together with Lenstra's rough measurements, enabled Lenstra to compute g precisely, just by drawing the lattices and looking at the possibilities.
"I found it amazing that there was only one answer," says Bart de Smit, a colleague of Lenstra's at Leiden who is managing the Escher project.
Visual Payoff
Once he had g and thus the transformation that converts the Droste picture into the Escher, Lenstra wanted to see the visual results of his efforts. Hoping that his formula could be used to write a computer program that would generate his own version of Escher's picture, Lenstra explained his discovery to some students and colleagues at Leiden. De Smit, a former student of Lenstra's, then took over.
|
|
|
|
|
|
|
|
|
|
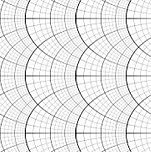
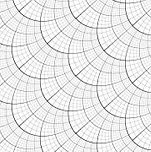
| Transformation of the "Droste picture" (grid at bottom left) into a distorted picture like Escher's "Print Gallery." The top two grids have a tiling symmetry, and they allow the vertical shift. The map between them is a rotation by about 41 degrees counterclockwise and scaling by about 75%. The vertical transformations are the exponential map on the plane of complex numbers. | ||
Before they could apply Lenstra's formula, the researchers had to obtain a copy of the Droste picture; Escher's original studies for "Print Gallery" belong to a private collector in Connecticut and were not accessible to the group. Joost Batenburg, a student at Leiden, used a computer program he wrote and Escher's grid to undo the distortion, square by square.
This was the most time-consuming and laborious part of the project, but the result was indeed a straightened picture (see sequence on page four, top left). In fact, Batenburg produced a series of four, each a blow-up of the center of the previous one.
As a starting point, however, these pictures were highly unsatisfactory. One problem was that part of Escher's blank patch, which was a little larger than the smaller copy of the picture in the center, translated into a blank cloudy spiral obscuring part of the scene. Moreover, because Escher's grid wasn't perfectly conformal, the Droste picture had some artistic problems: The perspective, for instance, was off. De Smit's solution was to recruit an artist, Hans Richter, who completely redrew the four pictures, using Batenburg's output as a guide (sequence on page four, top right).
To combine Richter's four frames into a single picture (page four, bottom left), Batenburg took logarithms and worked in the group C/Z×log 256 + Z×2pi. In this way, the multiplicative periodicity of the Escher picture turns into a doubly periodic tiling symmetry, where each of the four pictures is a translate of the others. Thus, the four frames could be pieced together side by side.
Another advantage to working in the additive world was a workaround for a difficulty with the grayscale. Ideally, the finished picture would have the same resolution when blown up by a factor of g, which means that the grayscale needed to become continuously denser moving toward the center. Computers don't allow this to be done in a straightforward way; to produce the desired effect in the final picture, the group asked another artist, Jacqueline Hofstra, to fill in the grayscale on the tiled version.
At this point, de Smit had the logarithm of the corrected grayscaled Droste picture. To move from C/Z×log g + Z×2pi to C/Z×log 256 + Z×2pi, they applied Lenstra's transformation. Between the lattices, the transformation corresponds to rotating the first lattice by about 41 degrees and scaling it by about 75% to obtain the second.
The final step was to apply the exponential function to this last picture, and voilà! A new and "improved" rendition of "Print Gallery," which can be viewed in still and animated form on the Escher Project Web site (http://escherdroste.math.leidenuniv.nl/.)
The Leiden group's version is strikingly similar to the original. Indeed, at first glance, the only difference seems to be that the center is filled in. Closer examination, however, shows other differences, particularly at the outer edges, where some lines curve in the opposite direction. Moreover, lines that should be parallel in the Escher picture are not. This is because Escher's design was not perfectly conformal, Lenstra says.
"The more you look at Escher, the more you find that he was not beyond cheating" to make his design work, he says.
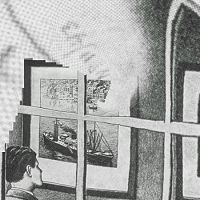
|
|
|
|
| Work in progress: the Escher Project at Universiteit Leiden. Above left, Using a computer program and Escher's distorted grid, Joost Batenburg undid the distortion of Escher's picture to produce the straightened version Escher had started with. Above right, the researchers had an artist fill in the missing patch and adjust the perspective. Left, Using the logarithm function to turn the multiplicative periodicity of the Escher picture into a doubly periodic tiling symmetry, the researchers made the artist's four frames into a single picture. | |
Escher: A Closet Mathematician?
By keenly confronting the enigmas that surround us, and by considering and analysing the observations that I have made, I ended up in the domain of mathematics. Although I am absolutely without training in the exact sciences, I often seem to have more in common with mathematicians than with my fellow artists.
– M.C. Escher (from To Infinity and Beyond, Eli Maor)
The only remaining mystery is that of Escher himself. Did he understand what he was doing? Did he leave the center blank so that he wouldn't have to forever repeat himself, or was he unsure of what should go there? Because the artist died in 1972, this part of the puzzle will forever remain a subject of speculation.
Hans de Rijk seems certain that Escher did not know that his picture was periodic, but just had some vague sense that things got smaller in the middle and he had to stop somewhere.
In his book, de Rijk quoted an amusing passage in a letter from Escher that seems to demonstrate Escher's ignorance of the mathematics:
"Two learned gentlemen, Professor van Dantzig and Professor van Wijngaarden, once tried in vain to convince me that I had drawn a Riemann surface. I doubt if they are right, in spite of the fact that one of the characteristics of a surface of this kind seems to be that the center remains empty. In any case, Riemann is completely beyond me and theoretical mathematics are even more so, not to mention non-Euclidean geometry. So far as I was concerned it was merely a question of a cyclic expansion or bulge without beginning or end."
Lenstra finds it hard to speculate about Escher's thought process: "I find it most useful to identify Escher with nature and myself with a physicist that tries to model nature," he says.
After the project was featured in The New York Times, a reader sent Lenstra his own completion of the picture, in which the spiral of buildings ends neatly at the center. Escher would have found this "dreadful," says Lenstra, since it was not consistent with his global idea.
Although Escher did not have a deep understanding of mathematics, it seems that his artistic vision incorporated a surprising mathematical consistency. Bart de Smit agrees: "We made our version of Escher's grid from a formula. There was only one way to do it and Escher modeled it very well. It wasn't completely right but it was almost right," he says. "I have respect for it."
"So do I," says Lenstra.
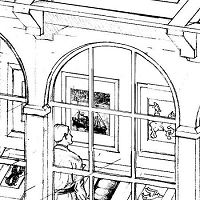
|
| The Leiden group's version of Escher's "Print Gallery"; the filled in blank patch is only the most noticeable difference between the two. |
Sara Robinson is a freelance writer based in Berkeley, California.
You can also read about creating Escher like image from photograph in article "Escher's Printgallery in Stanford".